The Mouse Math
Where would I ever use it?
Well isn’t it just what we say when a topic gets tough and you no longer want to continue reading that chapter. Laymen use this phrase to say why they don’t need the Pythagoras Theorem; it is alike for engineers too. Because you cannot see that topic in your conscionable future you feel your efforts worthless. However it’s not that that you would never need it but that you cannot see it in use or you using it that repels you from exploring further in that topic.
One of such hard to grasp and find-yourself-excited-about topics for computer engineers is Digital Signal Processing. Even though they know it is extremely important they don’t see much use in their efforts at understanding the topic maybe because of the failure to see direct practical implications. Convolution and cross-correlation and what not.
Let me tell you something fam, if you’ve used your mouse today you’ve used cross-correlation and we’re going to learn how.
If your mouse is from the 90s and it has a rolling ball underneath, you are in a dire need for update. If it’s optical then you’re using cross-correlation once every 60 microsecond.
I wanna know, have you ever looked underneath your mouse?
Let’s dive in.
An optical mouse uses a light-emitting diode (LED) to detect movement, as opposed to the traditional mechanical mouse that uses a rolling ball. It works by shining the LED or infrared(in latest models) onto the surface beneath the mouse to detect changes as the mouse is moved. The mouse then sends this information to the computer, which translates it into cursor movement on the screen.
You see that little detect changes part, that’s where the fun happens. An optical mouse depending on its model takes pictures at the rate of 1000s of frames per second of a tiny area underneath the mouse. With that the mouse is able to capture 100s of frame even for the smallest movement of the mouse. The frames captured are not even stored by the mouse but only used to compute the distance the mouse moved in the split second.
Now to extract the information of how much and in which direction the mouse moved, a chip inside the mouse (digital signal processing chip) computes the cross correlation between two images captured in succession.
What even is cross correlation?
Cross correlation in signal processing is a measure of similarity between two functions which is also called sliding inner-product or sliding dot product. It is a popular method used in pattern recognition and searching for features in signals. In single dimension the formula for computing cross correlation between two functions looks something like this:
\(IoF(n)= \sum_{i=-N}^{N}I(i)F(n+i)\)
Because an image is just an array of 2-dimensional discrete signals we can apply the same formula with an additional parameter for dimensionality.
\(IoF(x,y) = \sum_{j=-N}^{N}\sum_{i=-N}^{N}I(i,j)F(x+i,y+j)\)
where I is the image, and F is the filter or template we are correlating with the image.
This process of locating the identical features of one signal in another is known as template matching, extensively used in computer vision, pattern recognition and signal analysis.
Enough math and terminology, let us see what I mean with an example.

Custom Mousepad
For some reason, this is the custom mousepad your girlfriend chose as your birthday gift.
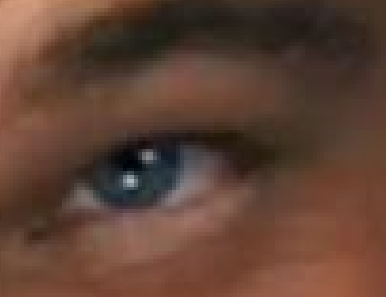
You plug in your mouse, on the new mousepad and load Valorant. The following is the image the mouse sees placed on Leo’s eye as you start moving around looking for the enemy. **
The image I have here is a bit larger than what a typical mouse would capture(40x40).

I in equation and eye in picture.
Say you moved your mouse aiming for that head and now the mouse sees this next image.
You moved your mouse such that the eye which was in the middle of the first capture is now in the top left half of the image, the rest we are discarding for illustration purposes, bear in mind that this is microseconds apart.

F in the equation
Now we need to find where exactly this second image coincides with the first. This is where we onload the math to do its work.
Thankfully it is pretty simple to demonstrate in python with a few lines of code, however in an actual mouse these computations would be embedded into the system chip so that you can enjoy your game at a blazing fast speed with exceptional precision.
The code is pretty straight forward and comments above the lines indicate what is actually happening.
#necessary imports
from scipy.signal import correlate2d
from PIL import Image
import numpy as np
import matplotlib.pyplot as plt

#load images in grayscale
img = Image.open('leoeye.png').convert('L')
img_moved = Image.open('leoeye_temp.png').convert('L')

#load images into numpy array
img_arr = np.array(img)
img_moved_arr = np.array(img_moved)

#normalizing the pixels in both images
img_arr = img_arr - img_arr.mean()
img_moved_arr = img_moved_arr - img_moved_arr.mean()

#compute correlation between two images
corr = correlate2d(img_arr, img_moved_arr)
#find the point of maximum correlation
y, x = np.unravel_index(np.argmax(corr), corr.shape)

#offset for the starting coordinates of template image
y = y - img_moved_arr.shape[0]
x = x - img_moved_arr.shape[1]

#lets see
fig , (ax_original, ax_moved, ax_corr) = plt.subplots(3,1, figsize=(6,15))
ax_original.imshow(img_arr, cmap='gray')
ax_original.set_title('original')

ax_moved.imshow(img_moved_arr, cmap='gray')
ax_moved.set_title('moved')

ax_corr.imshow(corr, cmap='gray')
ax_corr.set_title('correlation')
ax_original.plot(x,y,'ro')
plt.show()

Result
Now a few seconds wait (regrets not using cv2 library) and we get the answer that the image moved 77px to the right and 117px down, which in case of the mouse is its movement itself.
**********The movements have been exaggerated for demonstration purposes but actual mouse movements tracked microseconds apart wouldn’t be of such large margins. The mouse movements are however not updated on microseconds but in milliseconds by adding up these movements tracked in the millionth of seconds.**********
Most modern mouse use infrared images rather than plain photographic images. The undulating rough surface at the base of the mouse translating into pixel value intensities. You might have noticed your mouse acting weird which is the result of the mouse not being able to differentiate between the consecutive captures because of the smoothness of the surface.
Finally you know whom to blame when you miss your mark next time.
Enjoy Reading This Article?
Here are some more articles you might like to read next: